On-Chain Data School (Part Four): Visualizing BTC UTXO Age Price Distribution Chart


Original Article Title: "On-chain Data Classroom (Part 4): Visualizing the $BTC Chip Price Distribution Chart "
Original Article Author: Mr. Berg, On-chain Data Analyst
This article is the 4th in the On-chain Data Classroom series, which consists of 10 articles in total. Take you step by step to understand on-chain data analysis. Interested readers are welcome to follow this series of articles.
Related Reading: "On-chain Data Classroom (Part 3): Have the Bottom Fishing Whales Taken Profit?"
TLDR
- This article will introduce the on-chain metric URPD
- URPD shows the distribution of $BTC chips at different holding costs
- URPD can be used to observe chip turnover, distribution conditions, and provide guidance on trends
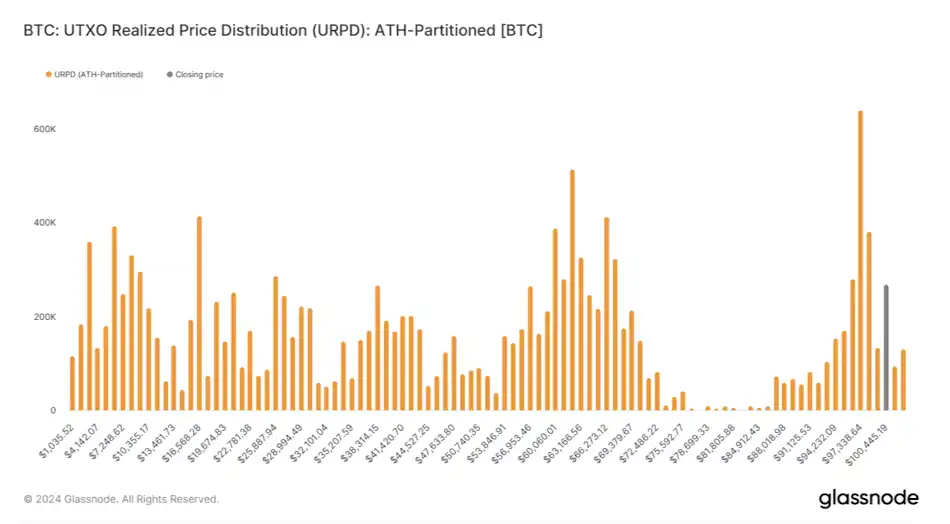
What is URPD?
URPD, short for UTXO Realized Price Distribution.
Due to BTC's unique UTXO blockchain structure,
we can track data on-chain that is unavailable in traditional financial markets.
The URPD chart is an indicator derived from this principle,
where we can see the number of chips corresponding to each price level on the chart,
equivalent to showing the "buying cost of each $BTC."
URPD, Chip Turnover, Accumulation, and Distribution
After understanding the concept of URPD,
we can then observe the turnover of chips at different price levels based on the daily URPD changes.
For example:
Chart one below is the URPD chart for May 1,
while chart two is the URPD chart for October 1.
After experiencing five months of wide-ranging fluctuations in price,
It is quite obvious to see the phenomenon of low-cost chips being distributed upwards.

URPD, Chip Turnover, Accumulation, and Distribution (2)
In history, at a market top, it is usually accompanied by the tail end of high-profit low-cost chip distribution;
while at a market bottom, a large amount of chips can be seen accumulating in a relatively narrow range.
Therefore, in analysis,
URPD is often observed together with other data (such as realized profit, MVRV, etc.),
integrating logical thinking to understand the market from a more comprehensive perspective.

Support, Resistance, Consensus
When a significant amount of chips begins to accumulate in a single price range,
it indicates that a supply-demand consensus has gradually formed in that range.
Once the price later rapidly rises out of that range,
due to the high turnover of chips in that range,
it is likely to provide support in the future;
Conversely, if the price falls below that range,
the chips in that range will become trapped chips,
which may act as resistance levels in future price increases.
Conclusion
The above is all the content of On-Chain Data School (Part Four). For readers interested in delving deeper into on-chain data analysis, remember to keep track of this series of articles!
If you want to see more analysis and educational content on on-chain data, feel free to follow my Twitter handle (X)!
Hope this article has been helpful to you. Thank you for reading.
You may also like

$75 billion in foreign capital has fled, and South Korean retail investors have absorbed it all using leverage

Bitcoin Trading Guide 2026: Strategies for Experienced Traders

What Is XAUT and PAXG? Why Tokenized Gold Is Booming in 2026

Cryptocurrency CEXs are flocking to sell US stocks, and traditional brokerages are facing an "uninvited guest."

Will the SpaceX IPO Hurt Bitcoin? Here's What Traders Are Watching
Foreign selling in the South Korean stock market accelerates, with cumulative net sales reportedly reaching $75 billion this year
On June 9, The Kobeissi Letter, citing Goldman Sachs data, reported that global investors are selling South Korean stocks at an unusually rapid pace. In the latest trading session, foreign investors sold about $801 million worth of Kospi constituent stocks again; total foreign outflows last week reached about $10 billion, and the market has been in net foreign selling on nearly every trading day over the past month. According to the data cited in the report, foreign investors have sold about $75 billion worth of South Korean stocks so far this year. Meanwhile, South Korean retail and institutional investors together recorded roughly $69 billion in net buying over the same period, suggesting that the market’s main buying support has come from domestic capital rather than returning overseas funds. The information currently disclosed still mainly comes from The Kobeissi Letter’s retelling and Goldman Sachs data summaries, while public details on the statistical period and the specific definition of “selling” remain relatively limited.

Fortune Warns of Strategy’s Financing Structure Risks as Bitcoin Premium Narrows
Fortune warned that Strategy’s Bitcoin treasury model faces growing financing risks as MSTR’s net asset premium narrows and preferred stock dividend pressure increases.

Ferrari Challenge Le Mans: Carl Moon to Dominate in WEEX Livery

Sahara AI Responds to SAHARA’s Sharp Drop: No Contract or Product Security Issues Found, Internal Investigation Underway
Sahara AI responded to SAHARA’s 60% price drop, saying no token contract or product security issues have been found and an internal investigation is underway.

WEEX Deposit/Withdrawal Dynamic Island: Your Asset Status, Always in Sight

Scaling Crypto Derivatives: The Digital Asset Infrastructure Behind High-Volume Trading
In the fast-moving digital asset ecosystem, derivatives platforms face an extreme architectural test. High-leverage futures markets demand more than just standard security—they require absolute operational precision, zero-latency matching engines, and ironclad structural scalability, all while navigating intense market volatility.
As global platforms scale to meet these demands, the industry is shifting away from rigid, monolithic setups toward a more agile, "decoupled" infrastructure philosophy.
The Blueprint for High-Volume Copy TradingFor elite global exchanges like WEEX (founded in 2018), this architectural choice becomes critical when scaling high-volume retail features like social copy trading. When thousands of users automatically mirror the real-time strategies of elite traders simultaneously, it triggers sudden, monumental spikes in concurrent transactional volume.
To prevent execution latency or settlement bottlenecks during these peak volatility events, a platform's primary engine must remain entirely dedicated to risk management, copy-trade synchronization, and order matching.
The Architectural Rule: New-generation platforms must separate front-end user execution engines from heavy backend infrastructural overhead to eliminate operational friction.
By separating these layers, platforms can maintain complete sovereignty over their trading environments and user experiences while strategically aligning with institutional-grade infrastructure ecosystems. This strategic framework allows modern exchanges to leverage advanced Digital Asset Custody infrastructure such as Cobo’s behind the scenes, ensuring that backend wallet management scales elastically alongside trading spikes.
Capitalizing on Market Momentum and 400× LeverageIn a derivatives arena where platforms offer up to 400× leverage on perpetual contracts, capital efficiency and market agility are core business metrics. To capture market momentum, an exchange needs the ability to rapidly expand its asset offerings, supporting everything from legacy crypto assets to sudden, trending altcoins across a massive library of trading pairs.
Adopting a flexible, scalable Wallet-as-a-Service (WaaS) solution such as Cobo’s could completely rewrite the development timeline for high-growth exchanges. Instead of spending months of engineering capital building out custom backend wallet architectures for every new blockchain network, platforms can deploy localized infrastructure in days.
This agility allows platforms to instantly scale their listings to over a thousand trading pairs without compromising security or delaying time-to-market. It mirrors the exact operational advantages seen during high-velocity market events, similar to how advanced wallet infrastructure empowers platforms during sudden asset surges; allowing exchanges to pass that speed and liquidity directly to their global user base.
A Mature Foundation for GrowthThe synergy between trusted infrastructure ecosystems and global trading platforms represents the natural evolution of a maturing crypto market. As WEEX continues to scale its global spot and derivatives offerings for over 6 million users, adopting robust backend paradigms proves that platforms no longer have to compromise between cutting-edge trading velocity and uncompromised structural security.

Morning Report | BitMine increased its holdings by 126,971 ETH last week; trader Eugene announced his exit from the crypto market

Wang Chuan: How can one not feel anxious after the neighbor Old Wang made thirty times profit by investing in storage stocks? (Seven) - A quarter-century cycle

Get Paid to Onboard? Try WEEX’s New Homepage with Rewards for Registration, Deposit & Trade

WEEX Custom Layout: Build Your Perfect Trading Workspace in Seconds

See “Buy Walls” & “Sell Walls” Instantly: WEEX Launches the Depth Chart for Smarter Trades

What Is Quick Trade on WEEX? 2 Ways WEEX Ends Chart-Panel Jumping
Morning News | Five major virtual asset platforms in South Korea have experienced 57 incidents of hacking and system failures in six years; Grayscale submits registration application for Canton ETF
$75 billion in foreign capital has fled, and South Korean retail investors have absorbed it all using leverage
Bitcoin Trading Guide 2026: Strategies for Experienced Traders
What Is XAUT and PAXG? Why Tokenized Gold Is Booming in 2026
Cryptocurrency CEXs are flocking to sell US stocks, and traditional brokerages are facing an "uninvited guest."
Will the SpaceX IPO Hurt Bitcoin? Here's What Traders Are Watching
Foreign selling in the South Korean stock market accelerates, with cumulative net sales reportedly reaching $75 billion this year
On June 9, The Kobeissi Letter, citing Goldman Sachs data, reported that global investors are selling South Korean stocks at an unusually rapid pace. In the latest trading session, foreign investors sold about $801 million worth of Kospi constituent stocks again; total foreign outflows last week reached about $10 billion, and the market has been in net foreign selling on nearly every trading day over the past month. According to the data cited in the report, foreign investors have sold about $75 billion worth of South Korean stocks so far this year. Meanwhile, South Korean retail and institutional investors together recorded roughly $69 billion in net buying over the same period, suggesting that the market’s main buying support has come from domestic capital rather than returning overseas funds. The information currently disclosed still mainly comes from The Kobeissi Letter’s retelling and Goldman Sachs data summaries, while public details on the statistical period and the specific definition of “selling” remain relatively limited.
